

This report was prepared by Vincent Cooper, University of the West Indies, Trinidad.
Figure 1 St. Kitts Island
Figure 2 Nevis Island
Figure 3. Raingauges on St. Kitts
Figure 4. Camp River Watershed
Figure 5. Bath Ghaut Watershed
Figure 6. College Street Ghaut and Wash Ghaut Watersheds
Figure 7. SCS normalized hyetograph for the Type III curve
Figure 8. Critical storm for Nevis based on the mean 100-year return period
Figures
Note: Select any image to view a larger view
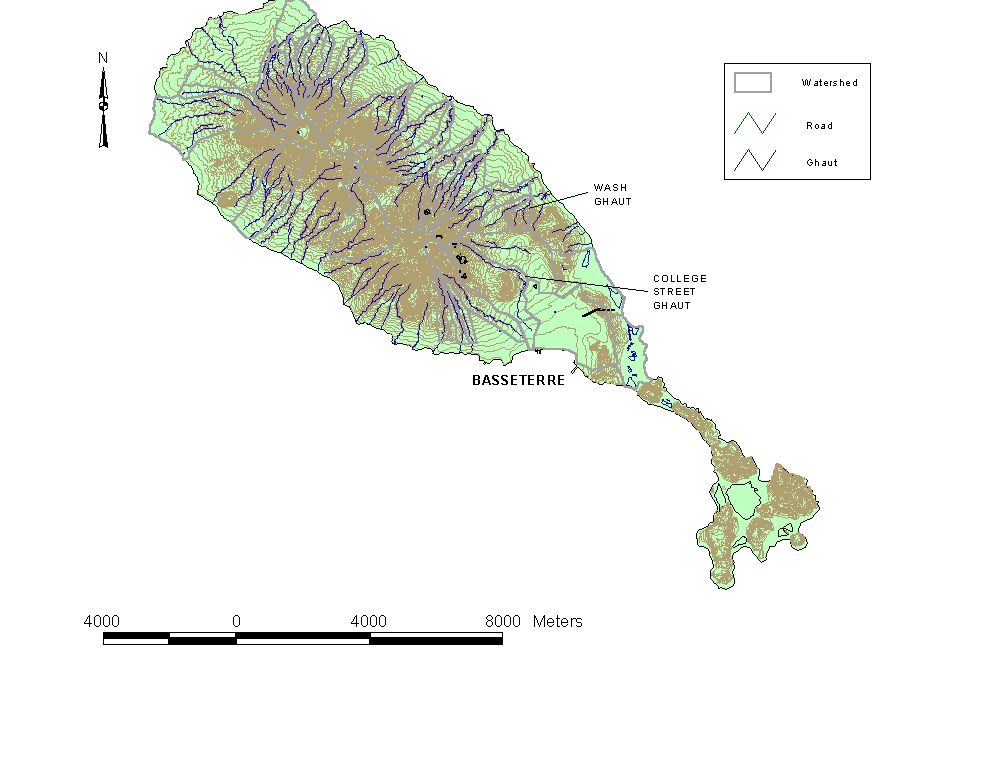
Figure 1. St. Kitts Island
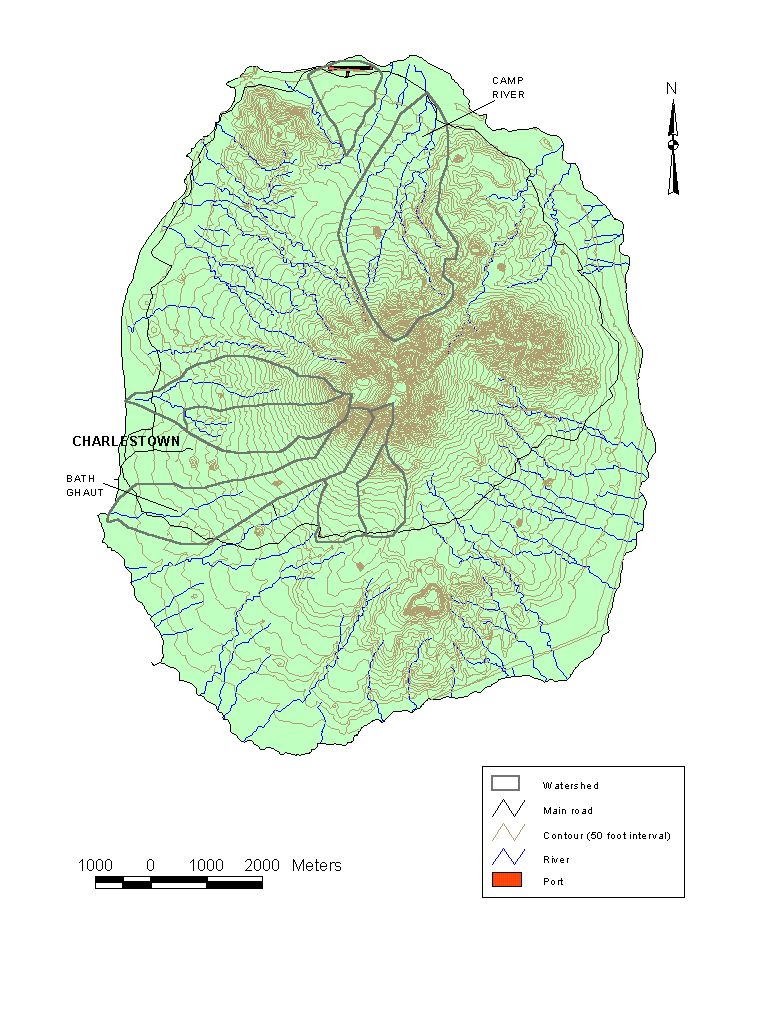
Figure 2 Nevis Island
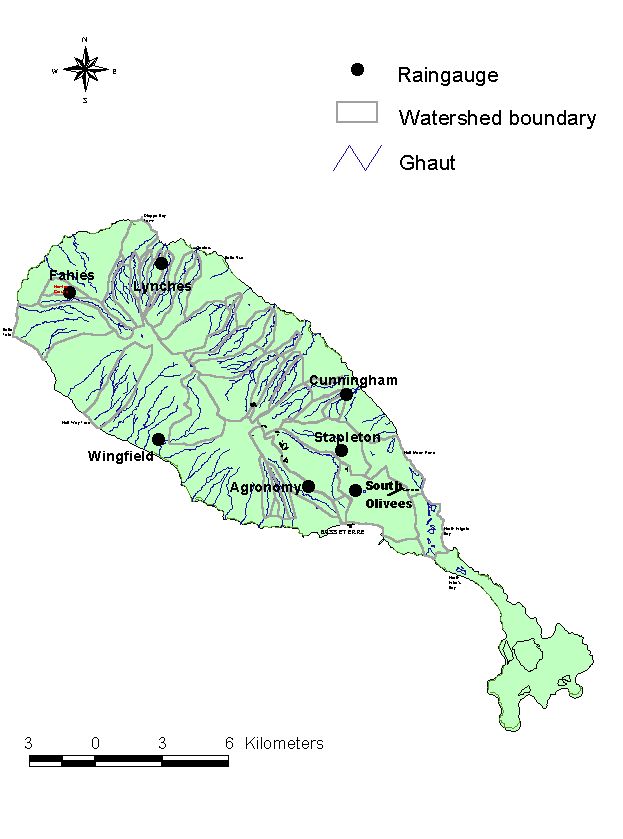
Figure 3. Raingauges on St. Kitts
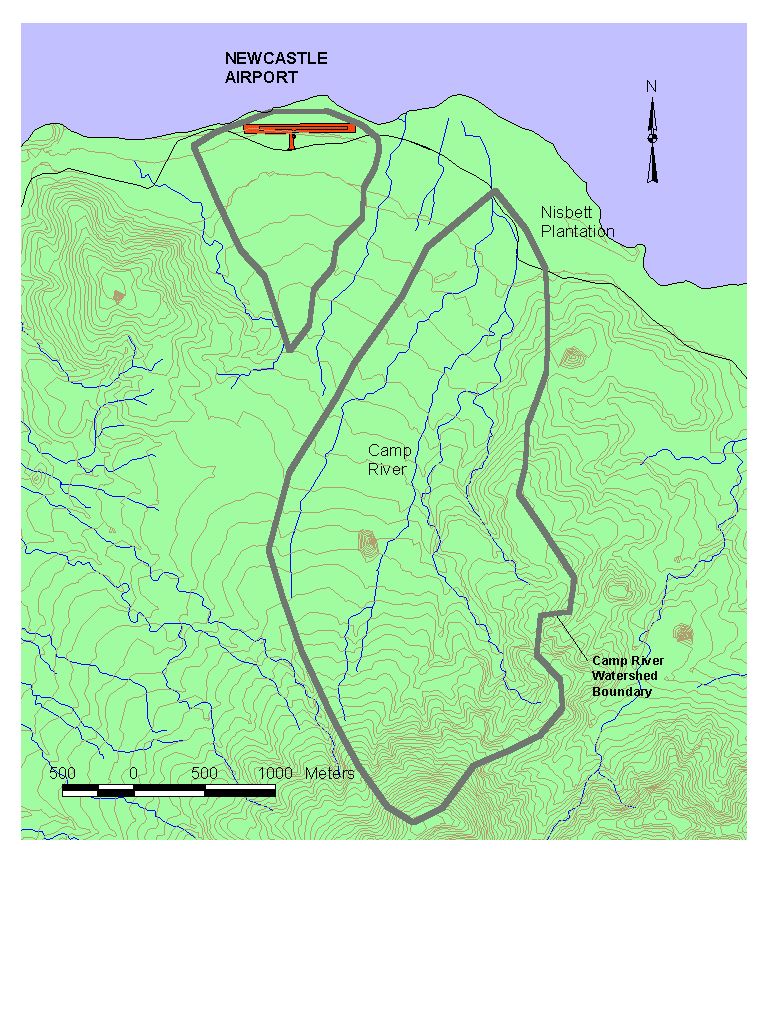
Figure 4. Camp River Watershed
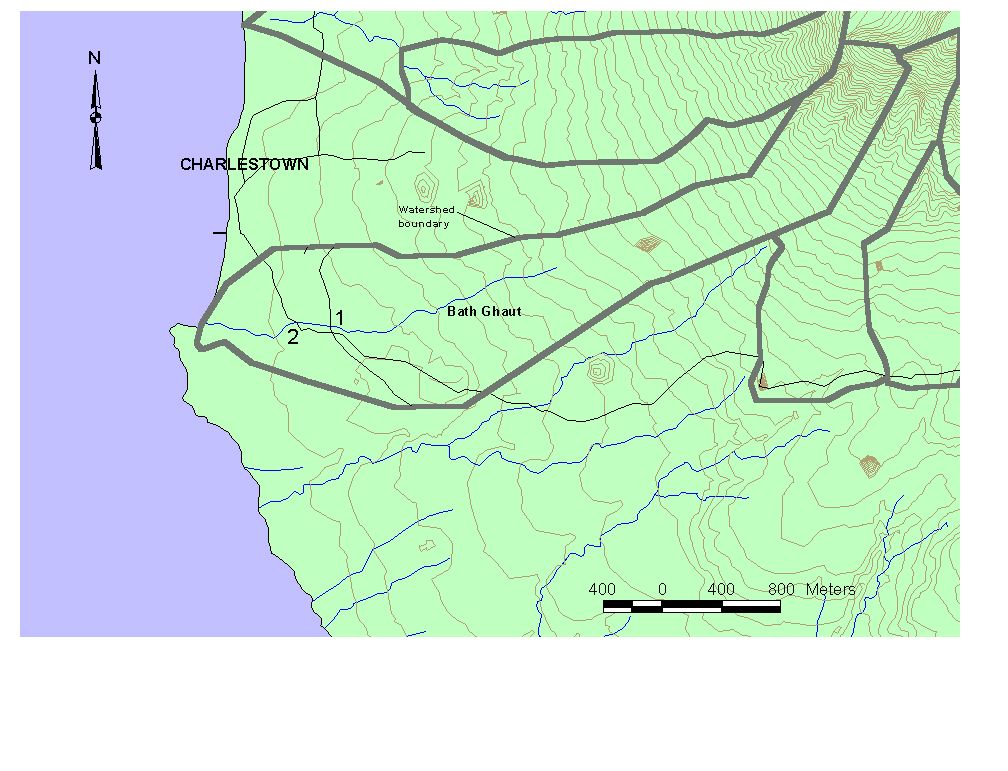
Figure 5. Bath Ghaut, showing the positions at which hydrographs were estimated.
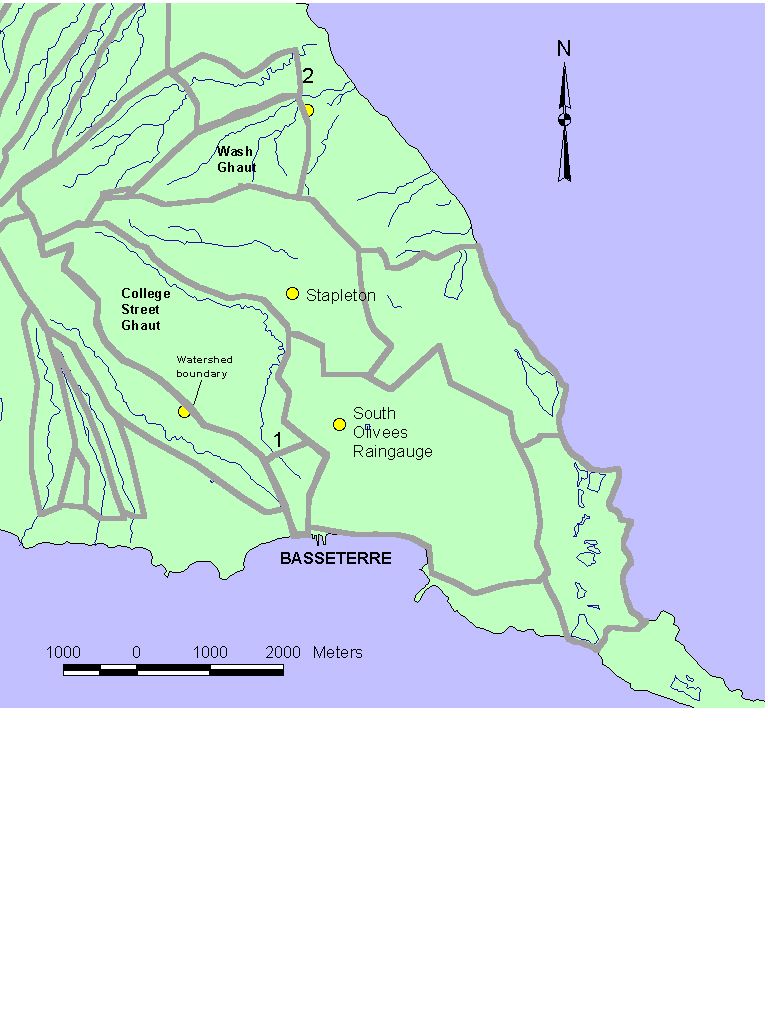
Figure 6 College Street Ghaut and Wash Ghaut Watersheds.
Figure 7 SCS normalized hyetograph for the Type III curve.
Figure 8 Critical Storm for Nevis based on the mean 100-year return period daily rainfall from St. Kitts.
Figure 9. Runoff hydrographs from sub-watersheds in the Bath Ghaut Watershed.
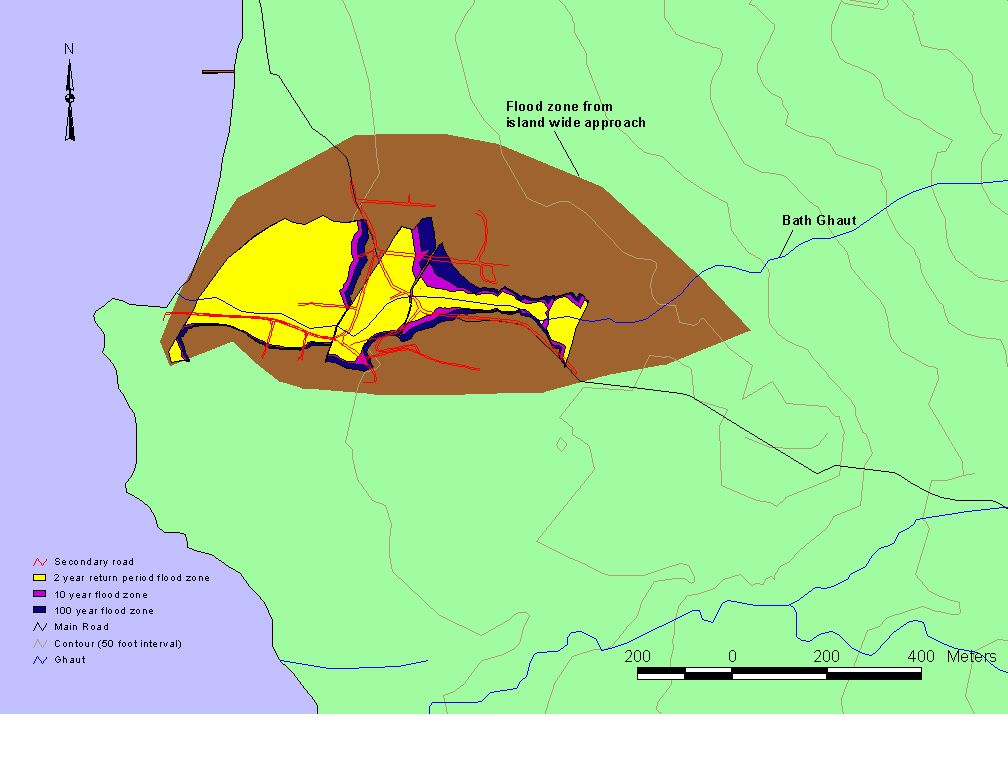
Figure 10. Flood zone within Lower Bath Ghaut generated by HEC-RAS
| USAID/OAS Post-Georges Disaster Mitigation: http://www.oas.org/pgdm | Page last updated on 22 Aug 2001 |