
Page 212 - GuideFWA
P. 212
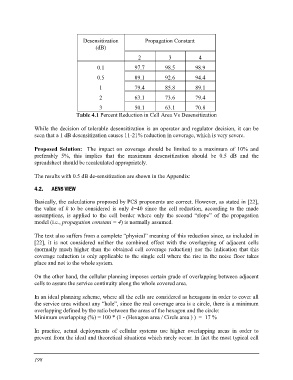
Desensitization  Propagation Constant
           (dB)

                      234

     0.1 97.7 98.5 98.9

     0.5 89.1 92.6 94.4

     1 79.4 85.8 89.1

     2 63.1 73.6 79.4

                 3 50.1 63.1 70.8
     Table 4.1 Percent Reduction in Cell Area Vs Desensitization

While the decision of tolerable desensitization is an operator and regulator decision, it can be
seen that a 1 dB desensitization causes 11-21% reduction in coverage, which is very severe.

Proposed Solution: The impact on coverage should be limited to a maximum of 10% and
preferably 5%, this implies that the maximum desensitization should be 0.5 dB and the
spreadsheet should be recalculated appropriately.

The results with 0.5 dB de-sensitization are shown in the Appendix:
4.2. AENS VIEW

Basically, the calculations proposed by PCS proponents are correct. However, as stated in [22],
the value of k to be considered is only k=40 since the cell reduction, according to the made
assumptions, is applied to the cell border where only the second “slope” of the propagation
model (i.e., propagation constant = 4) is normally assumed.

The text also suffers from a complete “physical” meaning of this reduction since, as included in
[22], it is not considered neither the combined effect with the overlapping of adjacent cells
(normally much higher than the obtained cell coverage reduction) nor the indication that this
coverage reduction is only applicable to the single cell where the rise in the noise floor takes
place and not to the whole system.

On the other hand, the cellular planning imposes certain grade of overlapping between adjacent
cells to assure the service continuity along the whole covered area.

In an ideal planning scheme, where all the cells are considered as hexagons in order to cover all
the service area without any “hole”, since the real coverage area is a circle, there is a minimum
overlapping defined by the ratio between the areas of the hexagon and the circle:
Minimum overlapping (%) = 100 * (1 - (Hexagon area / Circle area ) ) = 17 %

In practice, actual deployments of cellular systems use higher overlapping areas in order to
prevent from the ideal and theoretical situations which rarely occur. In fact the most typical cell

198