
Page 219 - GuideFWA
P. 219
Pr{I < x} (percent)99
rmin=100m
rmin=10m
90
70 Distribution of interference on
least-interfered channel
50
30 Assumptions:
FWA traffic density = 300 E/km2
5-km radius of interference, free space propagation
10 Downlink interference only
FWA "microbase" stations with 10 dBi gain
120 FWA channels
15 dB building attenuation
Cochannel interference only
1
-70 -65 -60 -55 -50 -45
x (dBm)
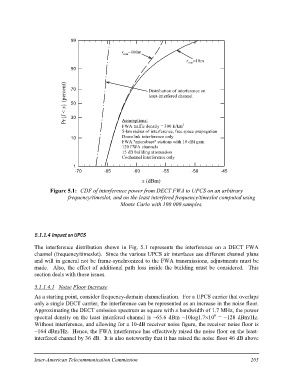
Figure 5.1: CDF of interference power from DECT FWA to UPCS on an arbitrary
frequency/timeslot, and on the least interfered frequency/timeslot computed using
Monte Carlo with 100 000 samples.
5.1.1.4 Impact on UPCS
The interference distribution shown in Fig. 5.1 represents the interference on a DECT FWA
channel (frequency/timeslot). Since the various UPCS air interfaces use different channel plans
and will in general not be frame-synchronized to the FWA transmissions, adjustments must be
made. Also, the effect of additional path loss inside the building must be considered. This
section deals with those issues.
5.1.1.4.1 Noise Floor Increase
As a starting point, consider frequency-domain channelization. For a UPCS carrier that overlaps
only a single DECT carrier, the interference can be represented as an increase in the noise floor.
Approximating the DECT emission spectrum as square with a bandwidth of 1.7 MHz, the power
spectral density on the least interfered channel is -65.6 dBm -10log1.7×106 = -128 dBm/Hz.
Without interference, and allowing for a 10-dB receiver noise figure, the receiver noise floor is
-164 dBm/Hz. Hence, the FWA interference has effectively raised the noise floor on the least-
interfered channel by 36 dB. It is also noteworthy that it has raised the noise floor 46 dB above
Inter-American Telecommunication Commission 205