
Page 228 - GuideFWA
P. 228
the received power levels are -67.1 dBm and -70.6 dBm. Thus, the Monte Carlo results and the
rough “hexagonal geometry” calculations agree closely.
5.1.2.3.3 Lack of Synchronization between FWA and UPCS
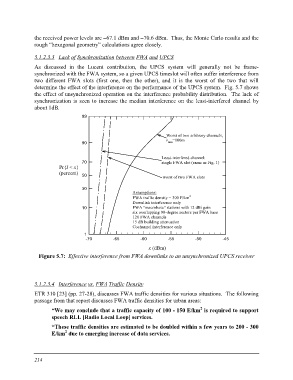
As discussed in the Lucent contribution, the UPCS system will generally not be frame-
synchronized with the FWA system, so a given UPCS timeslot will often suffer interference from
two different FWA slots (first one, then the other), and it is the worst of the two that will
determine the effect of the interference on the performance of the UPCS system. Fig. 5.7 shows
the effect of unsynchronized operation on the interference probability distribution. The lack of
synchronization is seen to increase the median interference on the least-interfered channel by
about 1dB.
99
Worst of two arbitrary channels,
90 rmin=100m
70 Least-interfered channel:
single FWA slot (same as Fig. 1)
Pr{I < x}
(percent) 50 worst of two FWA slots
30 Assumptions:
10 FWA traffic density = 300 E/km2
Downlink interference only
1 FWA "macrobase" stations with 12 dBi gain
-70 six overlapping 90-degree sectors per FWA base
120 FWA channels
15 dB building attenuation
Cochannel interference only
-65 -60 -55 -50 -45
x (dBm)
Figure 5.7: Effective interference from FWA downlinks to an unsynchronized UPCS receiver
5.1.2.3.4 Interference vs. FWA Traffic Density
ETR 310 [23] (pp. 27-28), discusses FWA traffic densities for various situations. The following
passage from that report discusses FWA traffic densities for urban areas:
“We may conclude that a traffic capacity of 100 - 150 E/km2 is required to support
speech RLL [Radio Local Loop] services.
“These traffic densities are estimated to be doubled within a few years to 200 - 300
E/km2 due to emerging increase of data services.
214